Ridgeline Maps · NHL data
Hockey Maps
Interactive maps and charts built from NHL data.

Where the NHL Grew Up
Where today's NHL players, and every NHLer since 1917, were born. Hover a team to fly its roster home; click a player for his career path.
Open the map →
Best Shooter at Every Spot
Shot rate, finishing efficiency, and per-season player profiles across the offensive zone, 2018–19 to 2025–26.
Open the atlas →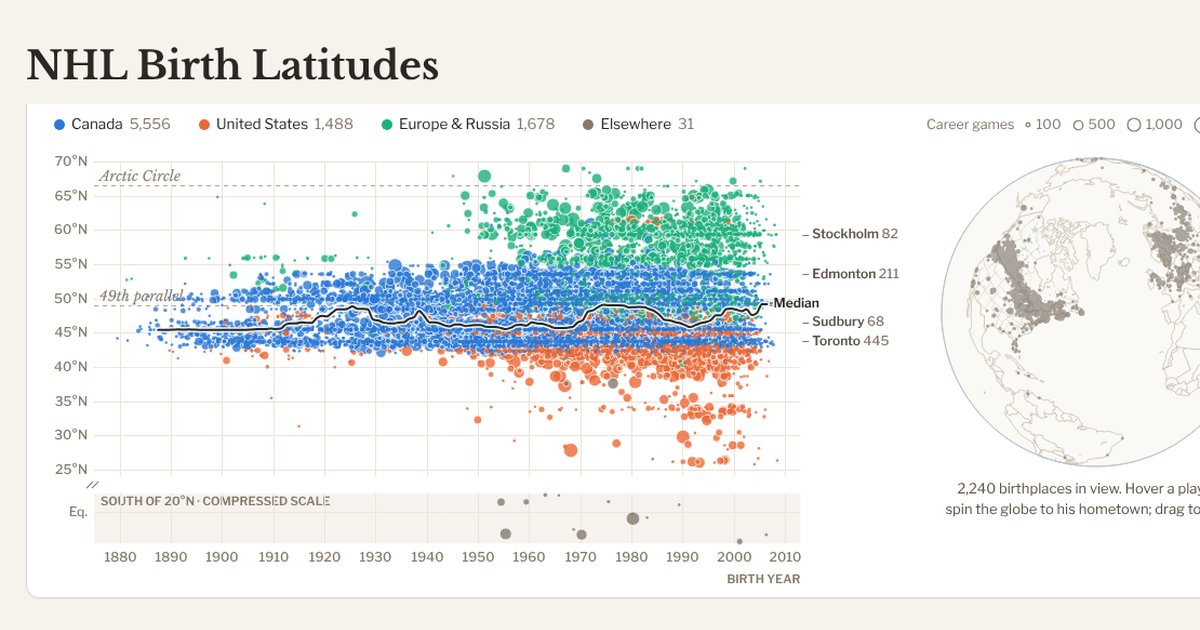
NHL Birth Latitudes
Every NHL player since 1917–18, placed by birth year and how far north he was born. Pick seasons, filter by continent, or split the chart by country.
Open the chart →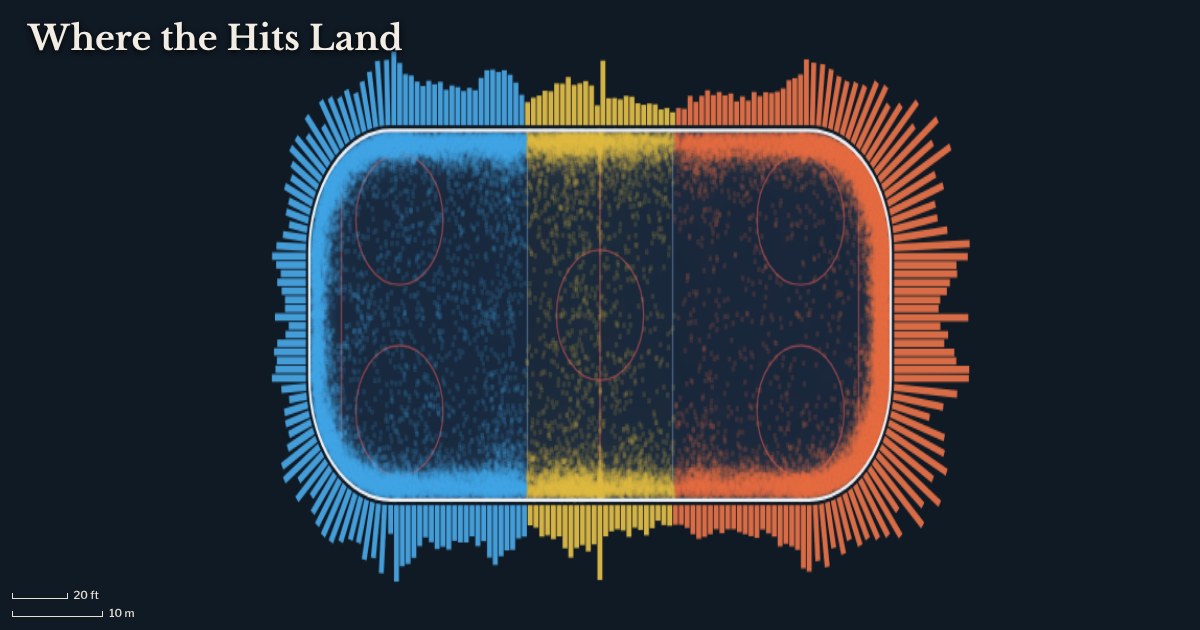
Where the Hits Land
All 53,658 hits of the 2025-26 season on one rink. Filter by team or period, zoom in, and hover the boards for hits per foot of wall.
Open the map →Need a map like this?
Ridgeline Maps makes custom maps of teams, players and the places you care about, for print, web and video.